|
See also:
|
| . |
. |
Number of people entitled to vote, Number of ballot papers issued |
. |
. |
| . |
. |
| . |
. |
. |
. |
. |
. |
. |
. |
. |
. |
. |
. |
| No. |
Name |
No. of polling |
No. of people
entitled to vote |
No. of
ballot papers
issued |
No. of: ballot papers issued / entitled to vote [%] |
| wards |
wards which
transmitted the results |
| 241603 | Irządze, gm. | 3 | 3 | 2312 | 114 | 4.93 |  |
| 241604 | Kroczyce, gm. | 5 | 5 | 4799 | 328 | 6.83 | |
| 241605 | Łazy, gm. | 10 | 10 | 13293 | 936 | 7.04 | |
| 241606 | Ogrodzieniec, gm. | 6 | 6 | 7854 | 636 | 8.10 | |
| 241607 | Pilica, gm. | 7 | 7 | 7547 | 769 | 10.19 | |
| 241601 | Poręba, m. | 5 | 5 | 7346 | 252 | 3.43 | |
| 241608 | Szczekociny, gm. | 9 | 9 | 6901 | 566 | 8.20 | |
| 241609 | Włodowice, gm. | 4 | 4 | 4222 | 318 | 7.53 | |
| 241602 | Zawiercie, m. | 34 | 34 | 44819 | 3426 | 7.64 | |
| 241610 | Żarnowiec, gm. | 7 | 7 | 3951 | 340 | 8.61 | |
| |
zawierciański, pow. |
90 |
90 |
103044 |
7685 |
7.46 |
 |
|
| |
| . |
. |
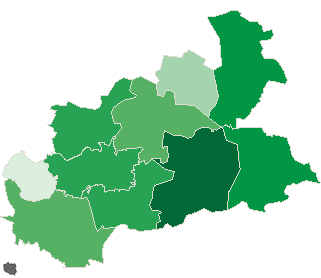
Turnout by location of ward electoral commission |
. |
. |
| . |
. |
| . |
. |
. |
. |
. |
. |
. |
. |
. |
. |
. |
. |
| No. |
Name |
No. of polling |
No. of people
entitled to vote |
No. of
ballot papers
issued |
No. of: ballot papers issued / entitled to vote [%] |
| wards |
wards which
transmitted the results |
| 1 | rural commune | 19 | 19 | 15284 | 1100 | 7.20 | |
| 2 | urban - rural commune | 32 | 32 | 35595 | 2907 | 8.17 | |
| 3 | urban commune | 39 | 39 | 52165 | 3678 | 7.05 | |
|
|


 Legal Acts

 Legal Acts